Graphic Collection (Paratext)
I see design essentially as a storytelling process, in the sense that I understand all human artifacts to be implicated in telling the story of the universe. I like the image of an archaeologist examining an artefact from a lost civilization. Many centuries after its designer lived, that artefact continues to suggest narratives about the culture that produced it.
– James Langdon, Insights 2015
In this project we’ll examine the paratextual layer of design online and how metadata (the information about information) and relational attributes organize and define perception.
To do this we’ll each create and display a ‘graphic collection’ that relates to and recontextualizes design within the network. What this collection is composed of is up to you, but it should reflect upon how aesthetics are defined on screen and online. For instance, do you look at the various ‘like’ buttons across different social media platforms? Or the relationships within a single graphic user interface – what are the different animations in Mac OSX? How do the sprite sheets embedded in many websites point to their underlying graphic structures? What are all of the color names in CSS and what do they tell us about who wrote them? How is gender represented in emoji?
After defining and generating your collection, you’ll enact agency through design to give them new meaning and reconfigure our understanding of them.
For this project you’ll have the option to code your entire website – which will offer more control over display and interaction. Or use the website-building platform Cargo – which enables more rapid and advanced development with less control.
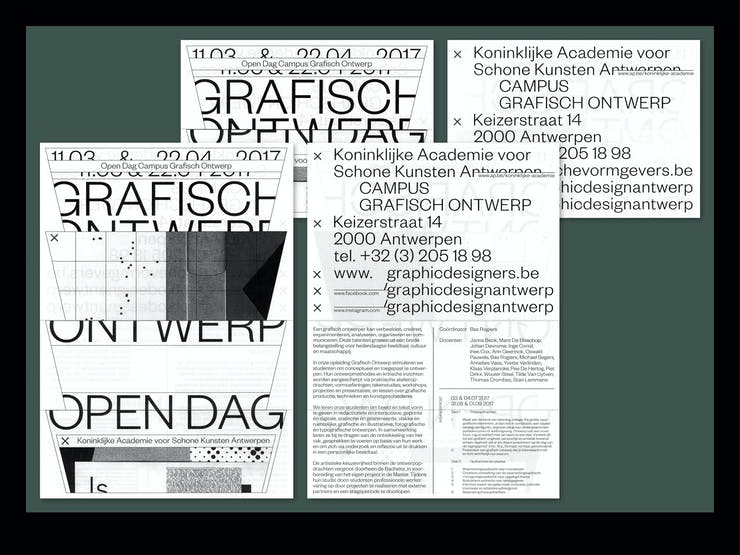
I was fascinated by the design of Safari tabs on our phones, the way they simulate sheets of paper in an archive. I utilized this interface in a sketch for the Open Day leaflet and signalization. Each poster was constructed by 9 smaller post(er)s, designed to look like separated tabs / windows.
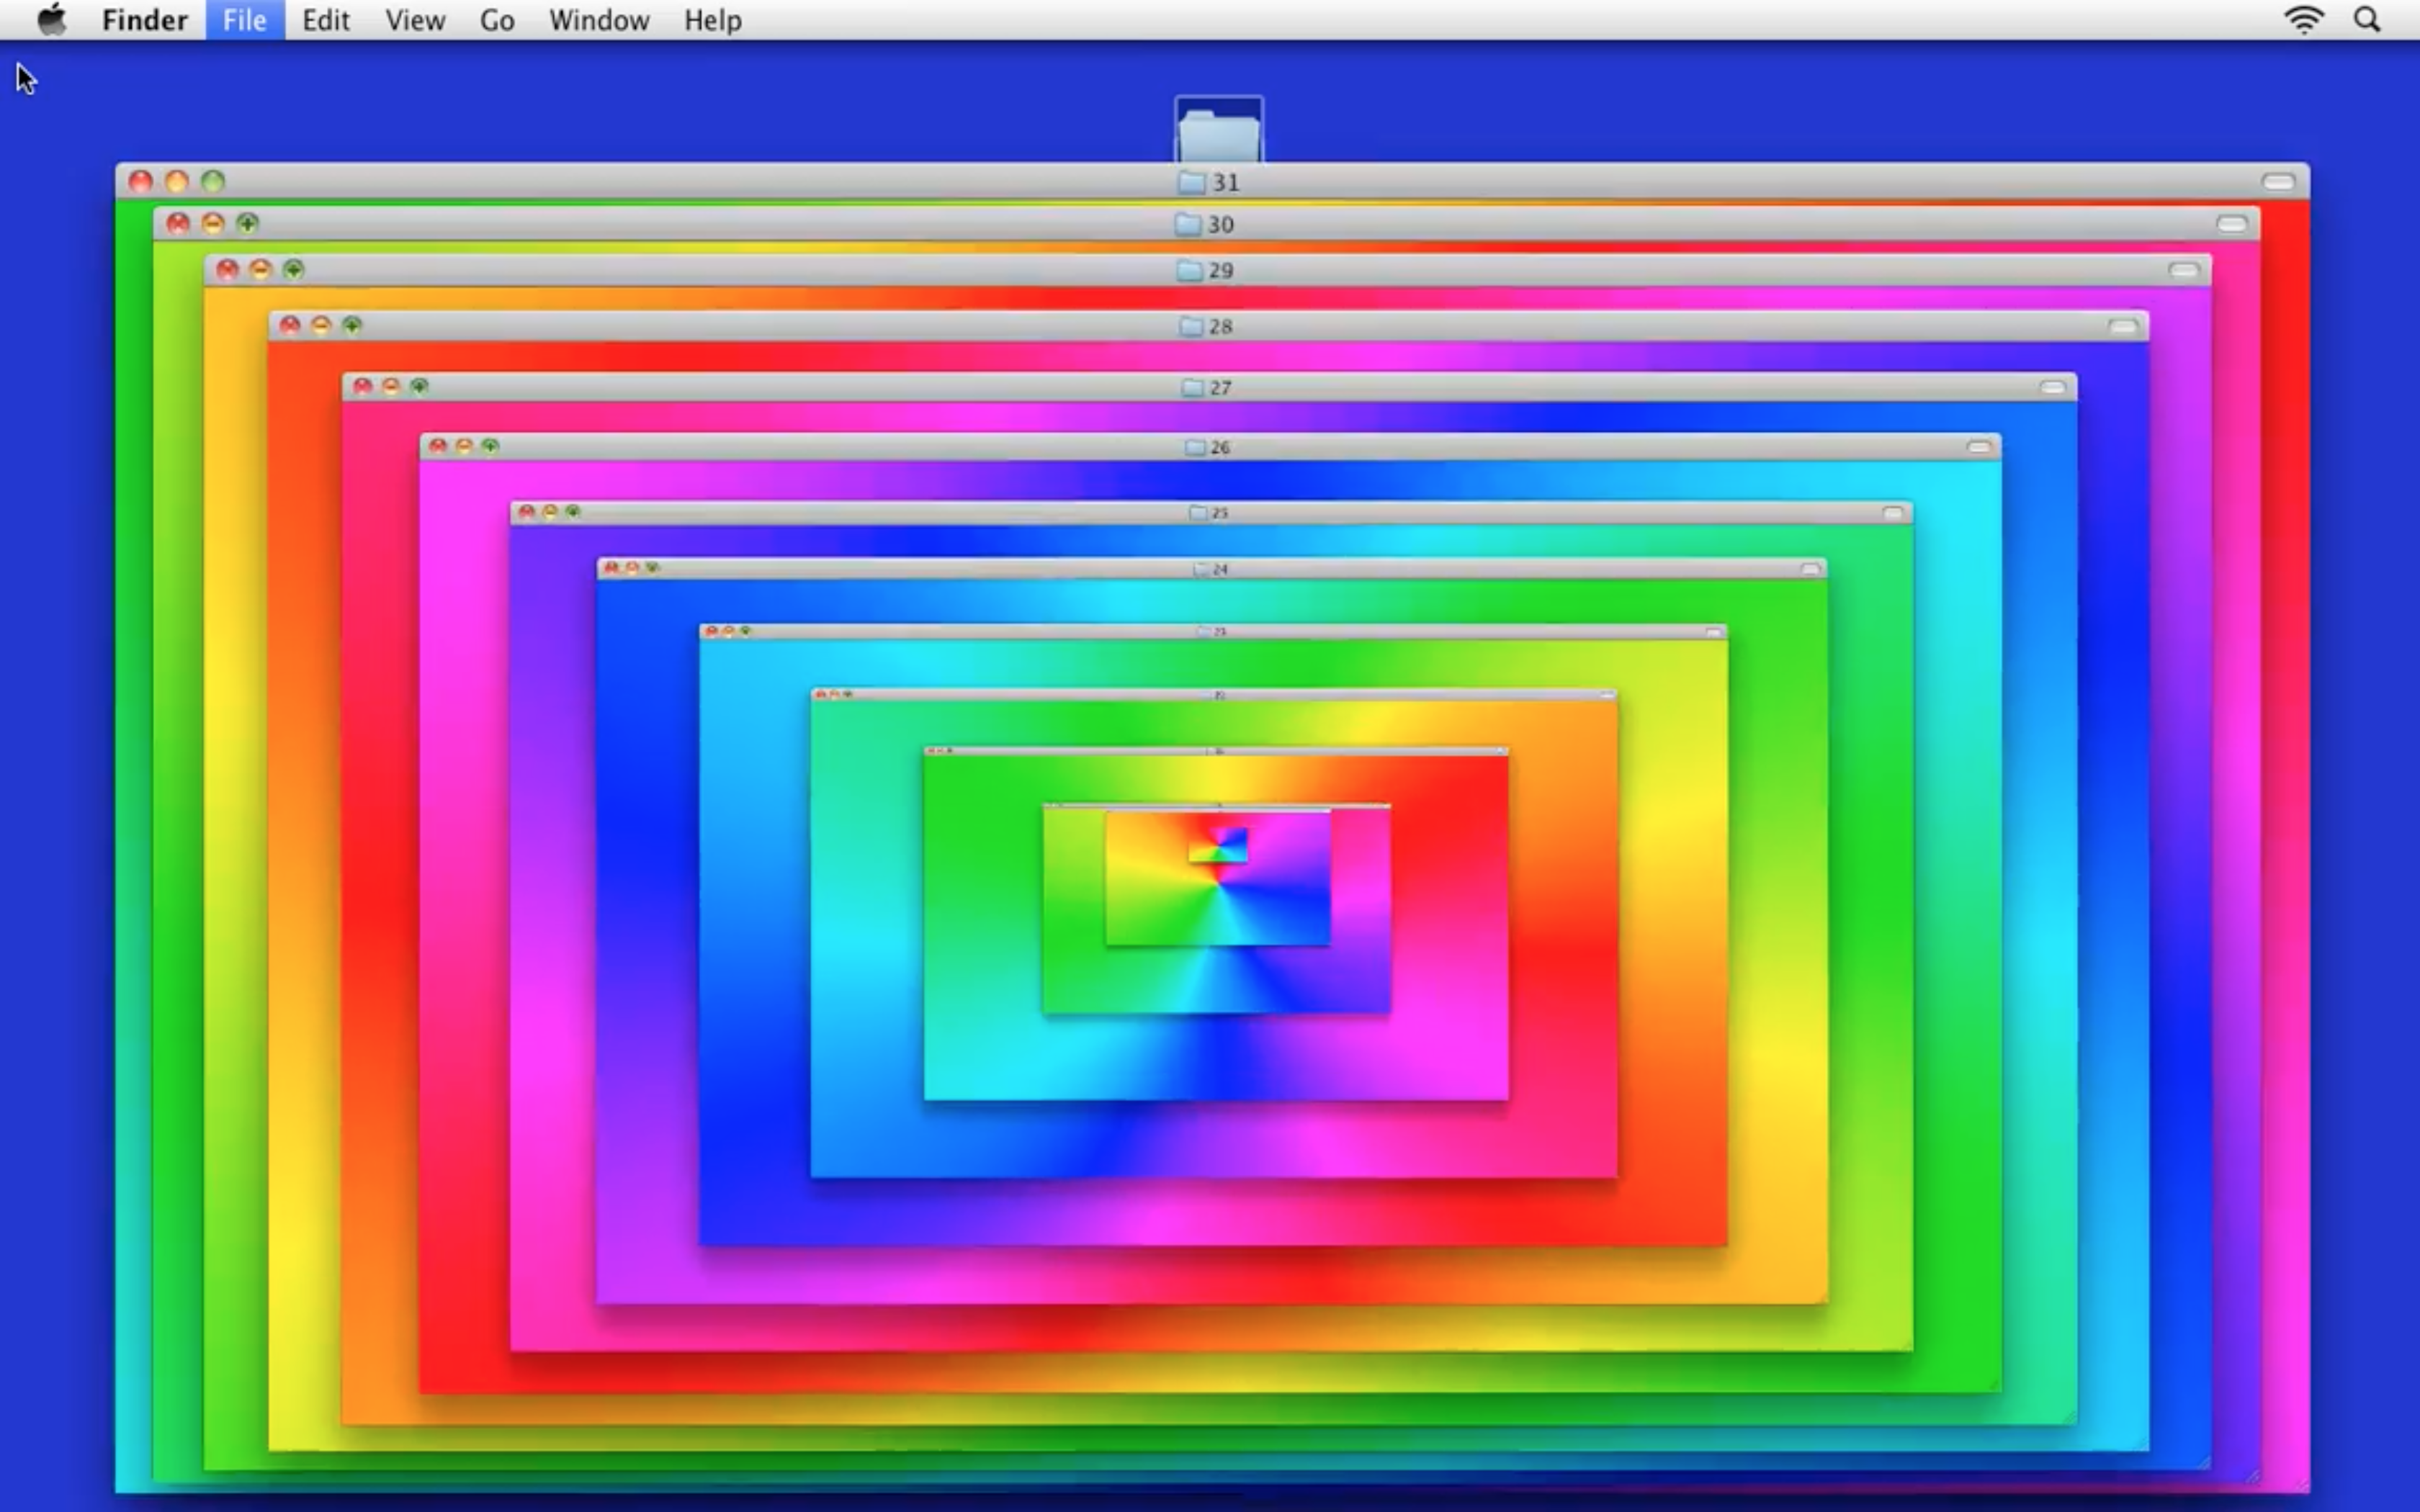
"Spinning Beach Folders" by Emilio Gomariz, 2015
Due April 5 (4 weeks)
Topics: Metadata, Platforms, Collection, Organization
Learning Outcomes
- Consider how metadata and graphic relationships create meaning
- Identify the current state of internet aesthetics, and understand the technical, social, and historical context that led to these conditions.
- Gain sensitivity to an ever-changing technical landscape, and its effect on visual culture.
- Expand basic HTML, CSS, and Javascript by creating a filterable or multi-page website.
Requirements
- 6+ graphics that define a collection
- Interactive graphic interface to reinterpret your collection
Project Kickoff: Mon March 8
Meta information and Online Graphics Discussion
Step 1: Due Mon March 15
Create proposals for two graphic collections as artboards on Figma. Each collection should have at least 6 graphics and be organized in an intentional way.
Step 2: Due Mon March 22
Once you’ve defined your collections, recontextualize them via their meta and relational attributes via a user interface. How can you re-tag, re-order, and re-articulate your collection via user experience? Create a prototype in Figma that demonstrates how interaction helps us gain new insights into your collection via clicking, scrolling, and other interactions (or in-actions).
Step 2: Due Mon April 5
Present your project as an interactive website.
Calendar
Week 8
Project kickoff
Creating Collections

Week 9
Share Collection
Step 1 Due

Week 10
Share UI Design
Step 2 Due

Week 11
Rough HTML/CSS

Week 12
Step 3 Due / Final Crit
Reading
- Black Gooey Universe, American Artist
- By Design, Alice Rawsthorne
- Ines Cox, The Process of Design Cannibalization, Ben Schwartz
- Brief Notes on the Art and Manner of Arranging one’s books, Georges Perec
- The Analytical Language of John Wilkins, Jorge-Luis Borges
- The Index, J.G. Ballard
Resources
- Cargo (sign up with you .edu email address and enter the code “4ad2b9ec” for free access)
References
- A Refusal by American Artist
- Map by Aram Bartholl
- Cameron's World
- Collect the WWWorld
- Macintosh Lab by Emilio Gomariz
- GEO GOO by JODI
- Numbers by Jon Gacnik
- The Poetics of Structure by Daniel Giuditta
- Scrollbar Composition by Jan Robert Leegte
- Flood Fill by Jürg Lehni
- The Malware Museum
- Ceiling Cat by Eva and Franco Mattes
- Satellite Collections by Jenny Odell
- Captcha Typefaces by Jiwon Park
- Abstract Browsing by Rafaël Rozendaal
- Sebastian Ly Serena
- DESKTOP IS by Alexei Shulgin
- Form Art by Alexei Shulgin
- Image Atlas by Taryn Simon and Aaron Swartz
- CSS Color Chart by Ainsley Wagoner